File:Energy Pulse.png
Jump to navigation
Jump to search
Size of this preview: 800 × 581 pixels. Other resolutions: 320 × 232 pixels | 913 × 663 pixels.
Original file (913 × 663 pixels, file size: 29 KB, MIME type: image/png)
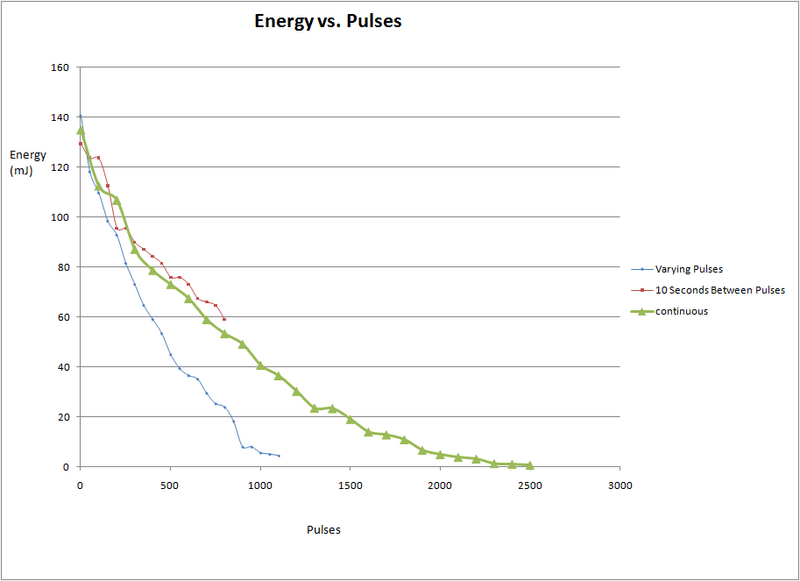
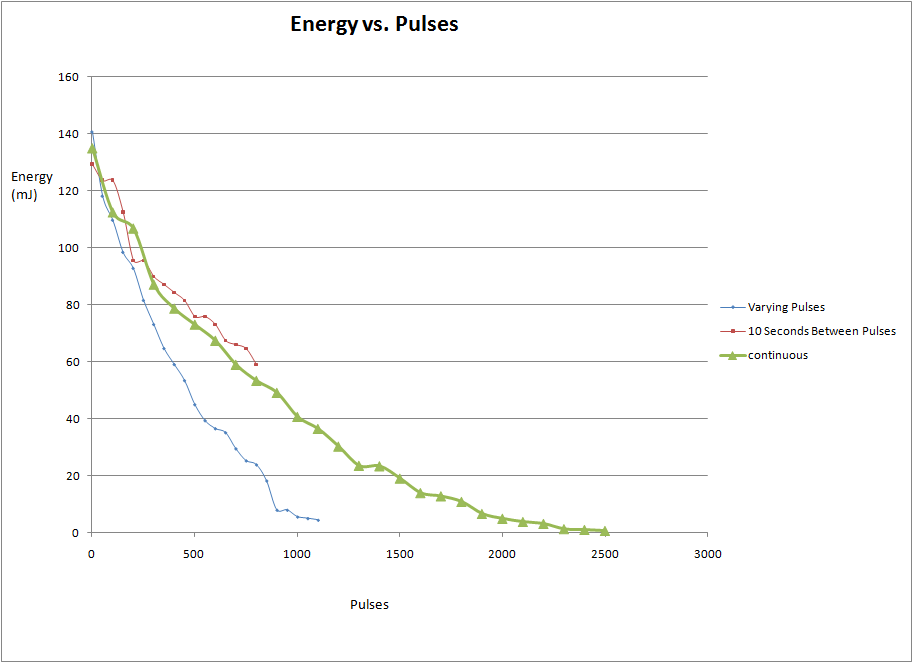
Knowing that the rep. rate was set to 10Hz allows us to extrapolate the energy dependence w.r.t. the number of pulses seen at that particular point. The blue line shows a larger drop and it is speculated that this is from the prolonged period of time the gas spent in the processor in comparison to the red and green plots.
File history
Click on a date/time to view the file as it appeared at that time.
| Date/Time | Thumbnail | Dimensions | User | Comment | |
|---|---|---|---|---|---|
| current | 16:43, 2 June 2010 | | 913 × 663 (29 KB) | Bpratt18 (talk | contribs) | Knowing that the rep. rate was set to 10Hz allows us to extrapolate the energy dependence w.r.t. the number of pulses seen at that particular point. |
You cannot overwrite this file.
File usage
There are no pages that use this file.